Virginia’s Deer with Justin Folks: Breaking Down the Harvest Summary
By Justin Folks/DWR
Photos by Meghan Marchetti/DWR
Welcome to the 2026 Virginia Deer Report, where we dive deeper into this past deer hunting season. This summer, we’ll talk about the 2025-26 deer harvest summary, the current deer population status, disease updates, and the importance of doe harvest. There’s a lot to cover, so let’s get to it with a look at the deer harvest summary from last season. You can see the 2025 State of the Herd deer report here.
During the 2025-2026 deer seasons, including the early September antlerless seasons (firearms and urban archery), hunters reported harvesting 227,302 deer, up approximately 10% from last year’s total of 205,759 over the same timeframe, and up 14% from the previous 10-year average of 198,666. This year’s total included 108,163 antlered bucks, 14,631 button bucks, 973 shed bucks, and 103,535 does (45.5%). Archers took 32,730 deer, while 51,472 were taken with muzzleloaders and 143,100 with firearms. 2,636 deer were reported harvested during Youth and Apprentice Weekend. In counties where it is legal to hunt deer with dogs, dogs were used to take 50% of the deer killed during firearms season and accounted for 35% of the annual kill there. The late antlerless seasons added about 2,000 more antlerless deer to the total harvest. Out of 177,541 deer licenses sold, 99,351 deer license holders reported harvesting a deer, yielding a 56% success rate (although it’s likely higher because some license holders may have only hunted turkeys).
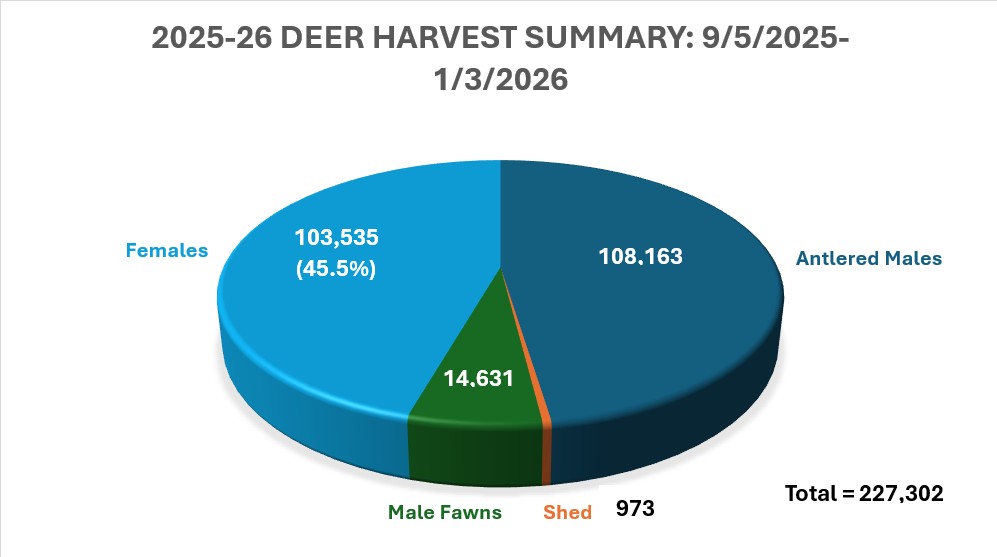
Harvest summary for the 2025/2026 deer seasons.
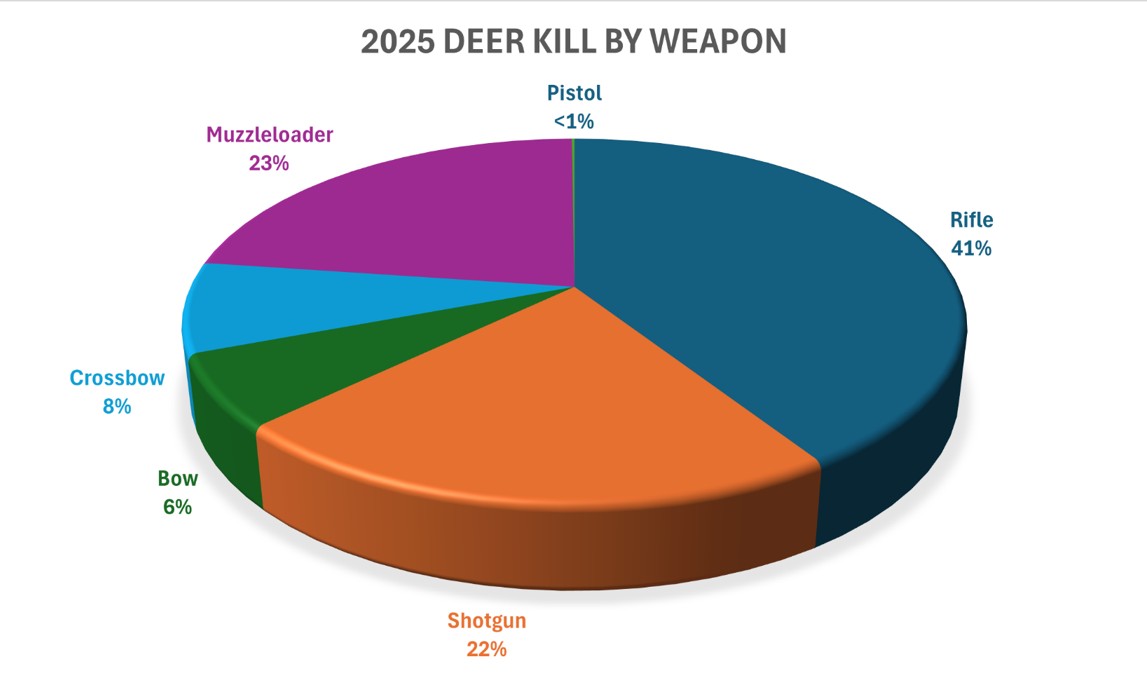
Percentage of each weapon used to take deer during the 2025-2026 season.
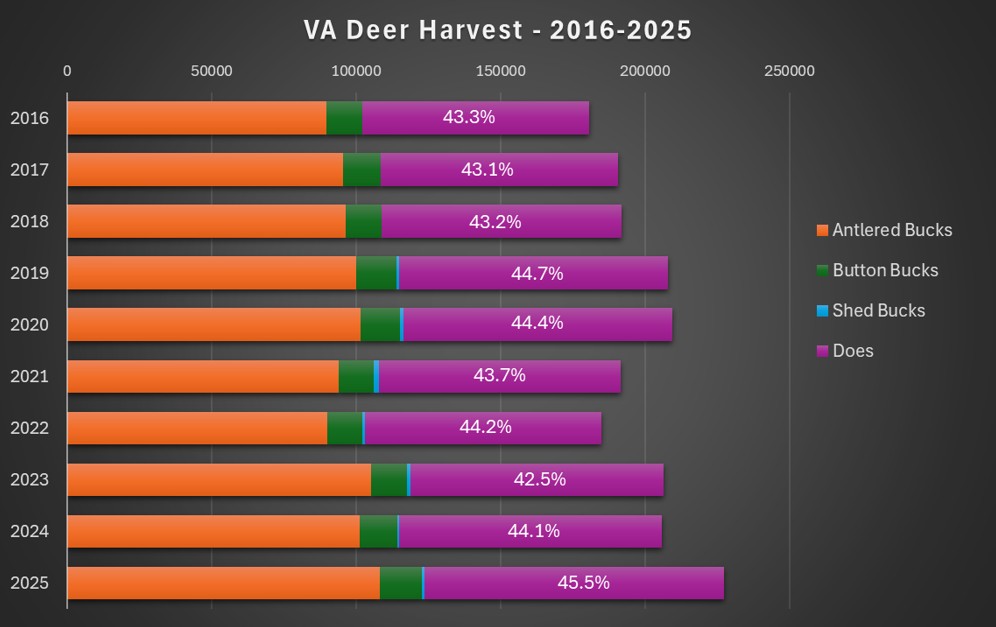
Virginia deer harvest summaries for the past 10 years. We saw a nice bump in percent females harvested this past season, which was needed in many areas of the state.
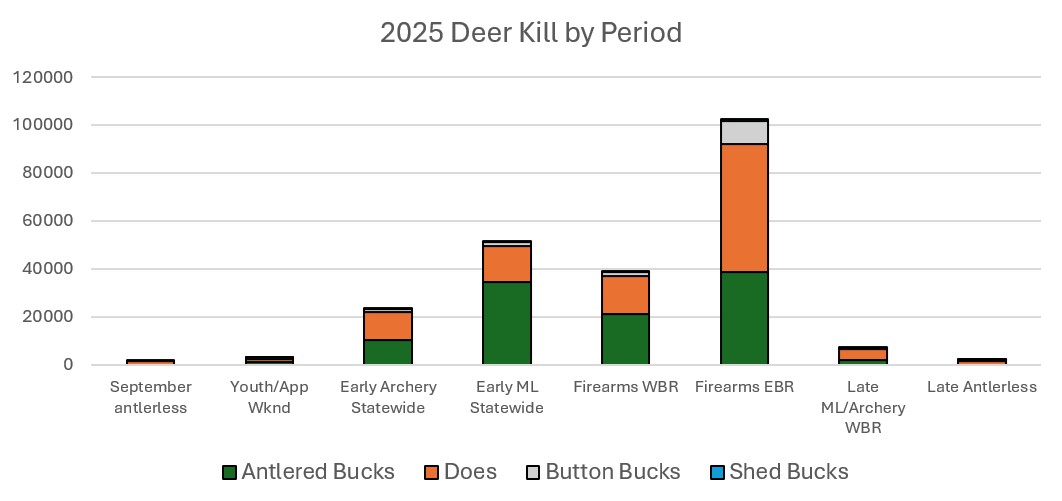
2025-26 Virginia deer kill broken down by period of deer season. These totals do not equal the final harvest total because of season overlaps and exceptions across the state. This data summary is to help illustrate the relative deer harvest intensity throughout the year in Virginia.
See more stats from the 2025-26 Deer Harvest Report.
A significant number of deer hunting regulations were changed this past season (most changes occurred in firearms season west of the Blue Ridge [WBR]) in efforts to increase opportunity and increase doe harvest to meet population objectives. To visualize the potential impacts these regulation changes may have had on deer kill on private lands WBR, see the graph below that shows the deer kill on private lands during the traditional two-week firearms season and the following two weeks of late muzzleloader (averaged over the previous four years) along with the deer kill during the new four-week firearms season on private lands WBR. Buck kill went up just 8 percent while doe kill increased 22 percent! It’s important to note that, in addition to increasing the length of rifle season, either-sex days increased substantially in many counties WBR during the last regulations cycle as well.
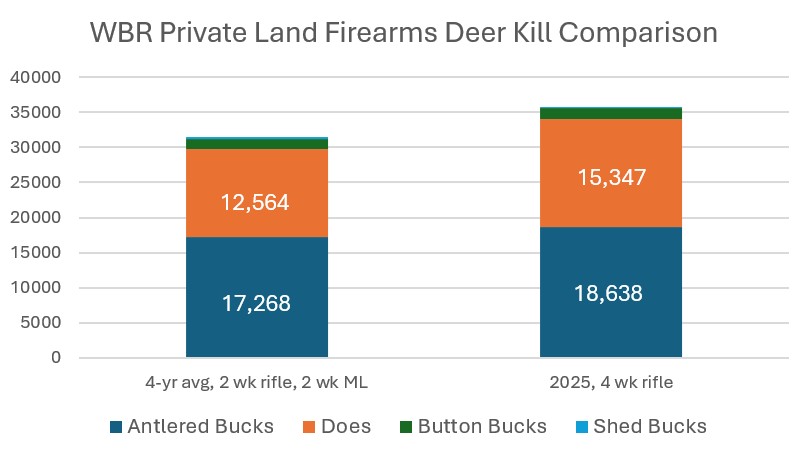
This graph compares the deer kill on private lands west of the Blue Ridge (WBR) from this past season (when firearms season was extended to at least four weeks in length) to the same four-week period (traditional two-week firearms season plus the following two weeks of late muzzleloader) over the previous four years. This graph doesn’t show just the impact of an increase in firearms season, but the combination of all regulation changes on private lands WBR (increased firearms season, increased doe days, and a couple of counties receiving the Earn-A-Buck regulation).
While these regulations likely contributed to the increased deer harvest, it’s not the whole story. The daily deer kill was ahead of last year’s pace from opening day of archery onward. As of writing this, it’s unclear what caused the increase throughout all seasons, especially considering the abundant mast (acorn) crop experienced across much of the state. Typically, when mast is abundant, deer kill goes down because deer don’t have to move far to find food.
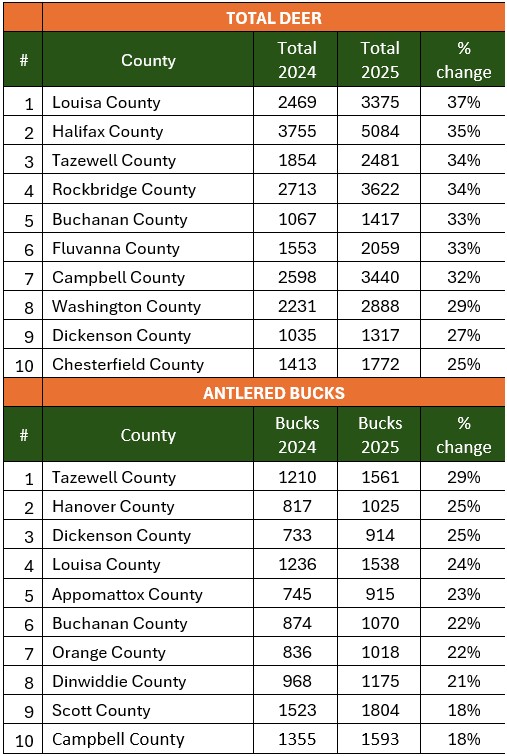
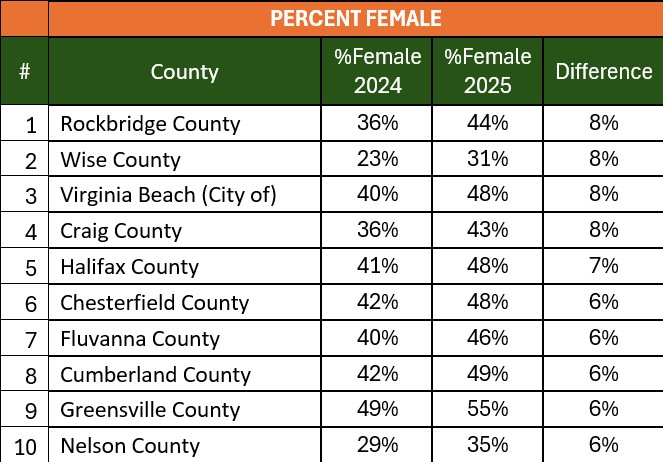
I was also curious which counties experienced the biggest differences between this past season and the year before. Below are the top 10 counties that saw the biggest changes in total deer kill, total buck kill and percent female. Keep in mind that this is only a snapshot comparison between 2024 and 2025.
We asked a new question during harvest reporting about outside spread of main beams to estimate the percentage of the buck kill that were yearlings, but a technological issue prevented getting that data from all bucks reported (some received the question and some did not). As such, no estimate of yearling bucks was made this year, but will be reported moving forward (update your GoOutdoors app!).
Ever wonder how many deer each deer hunter takes? See below! These figures are pretty consistent with most other whitetail states, although our average number of deer taken per hunter is a little higher, at 2.09 deer per successful hunter in 2025, whereas most other states are slightly under two deer per hunter. These figures likely change when you throw in license-exempt hunters, but we currently aren’t able to include license exempt hunters because they don’t have a unique identifier (like the customer ID number).
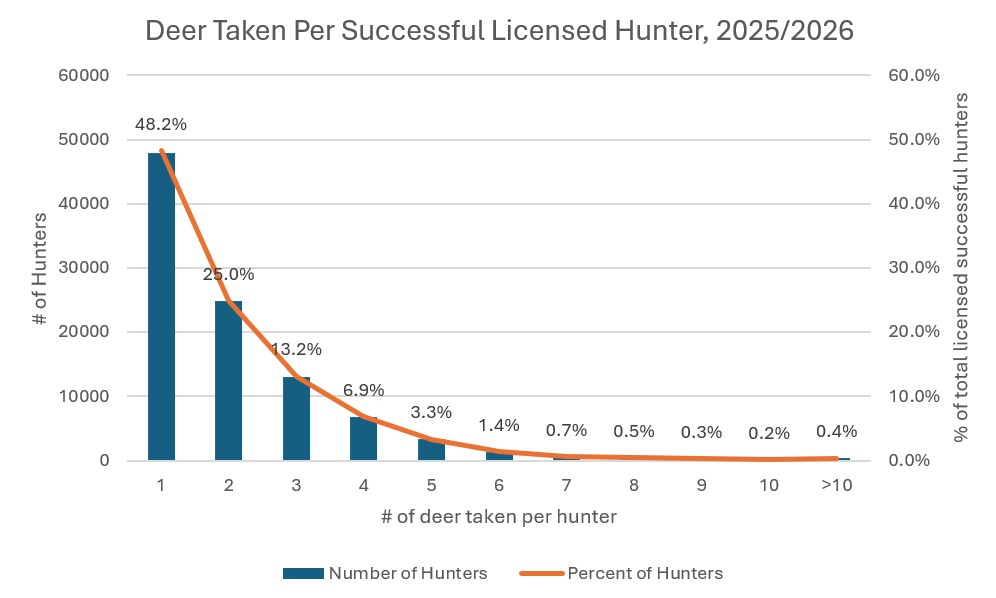
Number of deer taken by successful licensed hunters in the 2025/2026 deer season. Almost ¾ of successful licensed hunters take two or fewer deer, with majority taking only one deer. Only 1.4% actually “tagged out” by taking six deer, and only about 2% of successful licensed hunters combined exceed the annual bag limit via bonus, DMAP, DPOP, and/or DCAP tags.
While not a perfect measure, tracking the percentage number of bucks reported with 8 or more points suggests an older buck age structure and increasing level of selectivity by hunters over time. VDWR did not maintain records of the number of antler points until 2004, when the electronic reporting option was first made available. VDWR went to full electronic reporting in 2021.
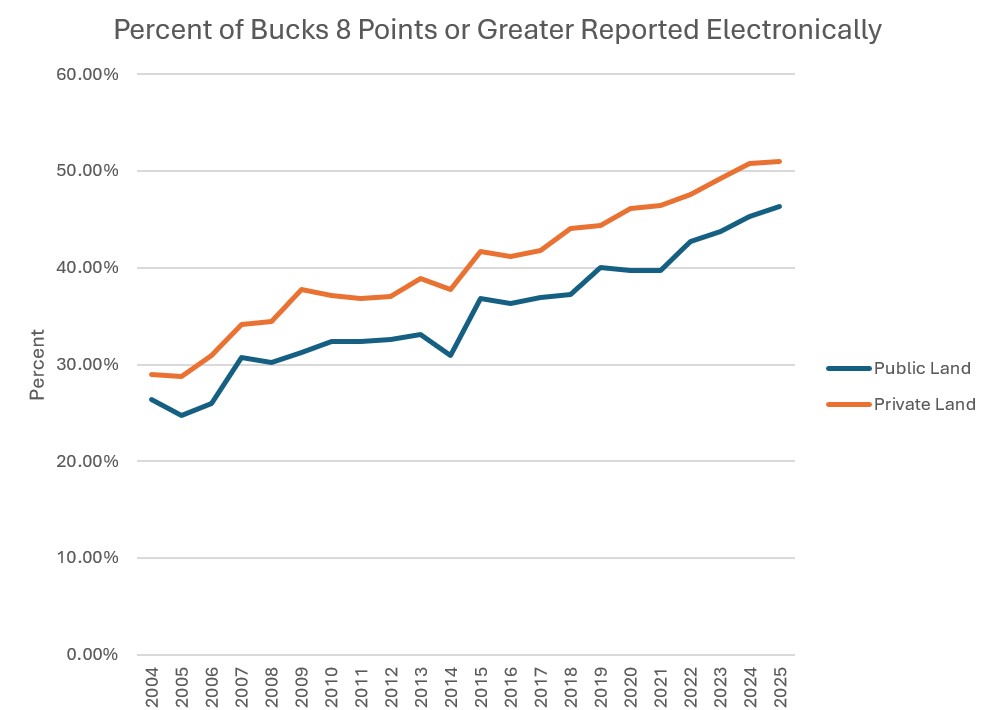
The percentage of bucks reported electronically that had eight or more antler points since 2004 for both public and private lands.
Stay tuned for next month’s blog about the deer population status!
Justin Folks is DWR’s Deer Project Leader.
Legal Disclaimer:
EIN Presswire provides this news content "as is" without warranty of any kind. We do not accept any responsibility or liability for the accuracy, content, images, videos, licenses, completeness, legality, or reliability of the information contained in this article. If you have any complaints or copyright issues related to this article, kindly contact the author above.
